When a user asks a financial question, the chart should actually answer it.
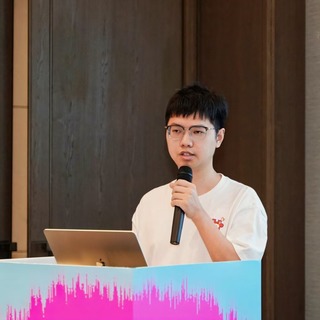
I lead data visualization in the AI department at Hithink RoyalFlush. Over the past 15 years, I have built financial web products for individual investors and company-wide visualization infrastructure. In recent years, I have focused more on AI-generated visualizations: whether models understand the question, choose the right metrics and algorithms, and produce genuinely useful visuals. I also explore how interaction helps people understand, check, and refine the results of visualization agents.
This blog records my engineering practice and learning. See my personal website for career history and full research records.
Selected achievements
- HiVis: A Web-Based Library for Financial Data Visualizations
Journal of Visualization · 2026 · Published - PictorVis: Automatic Pictorial Chart Generation with Context-aware Asset Selection and Style Control
PacificVis · 2026 · Poster accepted - The Lighthouse: Shining a Light on the Gender Gap in Economic Engagement
PacificVis 2025 Visual Data Storytelling Contest · Winner - Data Visualization Narrative Generation Based on Narration
Granted · Co-inventor · May 2026 · ZL 2025 1 1138659.8 / CN 121071134 B
Education and credentials
- Admitted to the M.S. in Computer Science program (Artificial Intelligence)
College of Computing, Georgia Institute of Technology · Spring 2027 · Enrollment pending
An online master's taken while working full time, with the coursework running alongside the job. The prerequisite was a TOEFL score of 100, which I wrote up in "From TOEFL 53 to 100". - B.Eng. in Electronic Information Technology and Instruments
Hangzhou Dianzi University, China · Sep 2007 – Jun 2011 - Certified System Architect
- Hangzhou Category E High-Level Talent
- Associate Senior Engineer professional title