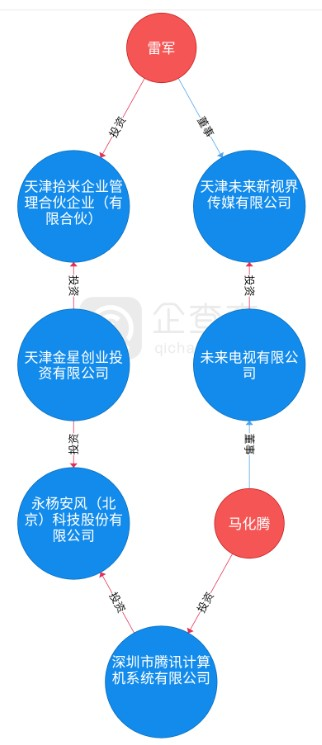
我们需要实现一个体现人物关联关系的可交互的图形,类似这样:
要求:
1、每个节点都是可以拖动的,且拖动的时候,与该节点关联的线条、箭头,都要随之同步移动;
2、页面要支持缩放和平移;
3、点击节点和线条上的文字,可以在页面底部显示其他相关的信息。
虽然目前有一些开源组件可以实现大致的效果(比如vis.js),但是我们考虑到后续需求可能存在一些比较特殊的个性化内容,为了增加我们的自定义能力,准备考虑用D3.js来自己实现这个图。
接下来就对里面的每一块内容进行拆分,分析其实现方案。
数据结构 关系图的数据结构,基本上都是类似的,主要分为节点和关系线条两部分。
节点(Node) 节点的数据部分,要注意给每一个节点设置一个唯一的id,因为后面其他元素的定位、交互,都要依赖这个唯一id。
另外这个图的层级是预先排版好的,每个节点都有确定的层级,因此每个节点还需要带有一个depth属性。
1 2 3 4 5 6 7 8 9 10 11 12 13 14 15 16 17 18 19 20 21 22 23 24 25 26 27 28 29 30 31 [{id : 1 ,name : '雷军' ,type : 'person' ,depth : 0 ,id : 2 ,name : '天津拾米企业管理合伙企业(有限合伙)' ,type : 'company' ,depth : 1 ,id : 3 ,name : '天津未来新世界传媒有限公司' ,type : 'company' ,depth : 1 ,id : 4 ,name : '马化腾' ,type : 'person' ,depth : 2 ,id : 5 ,name : '深圳市腾讯计算机系统有限公司' ,type : 'company' ,depth : 2 ,
关系(Relationship) 关系数据,需要包含关系线条的起止节点id,以及这个关系的类型(用于后面画关系中间的标签内容):
1 2 3 4 5 6 7 8 9 10 11 12 13 14 15 16 17 18 19 20 21 22 23 24 25 26 [{from : 1 ,to : 2 ,type : 'invest' from : 1 ,to : 3 ,type : 'executive' from : 3 ,to : 4 ,type : 'executive' from : 4 ,to : 5 ,type : 'invest' from : 5 ,to : 2 ,type : 'invest'
计算节点的坐标 因为展示的时候是按照层级展示的,因此需要先计算好每个节点在页面上的坐标。
逻辑就是将同一层级的节点筛选出来,然后根据该层级的节点数量以及画布宽度,计算每个节点的位置。
1
2
3
4
5
6
7
8
9
10
11
12
13
14
15
16
17
18
19
20
21
22
23
24
25
26
27
28
29
30
31
32
33
34
35
36
function computeCoordinatesForNodes (nodes ) {let verticalHeight = 100 ;let horizontalWidth = 100 ;let depths = [];forEach (node =>let depth = node.depth ;if ('undefined' === typeof depths[node.depth ]) {depth ] = [];depth ].push (node);let nodesWithCoordinates = [];let singleNodeAreaHeight = (options.grid .height - options.grid .paddingTop * 2 ) / depths.length ;for (let i = 0 ; i < depths.length ; i++) {let singleNodeAreaWidth = (options.grid .width - options.grid .paddingLeft * 2 ) / depths[i].length ;for (let j = 0 ; j < depths[i].length ; j++) {let nodeX = options.grid .paddingLeft + (j + 0.5 ) * singleNodeAreaWidth;let nodeY = options.grid .paddingTop + (i + 0.5 ) * singleNodeAreaHeight;'x' ] = nodeX;'y' ] = nodeY;push (depths[i][j]);return nodesWithCoordinates;
页面元素 由于这个关系在极限数据下,也不会太多,因此我们选择用SVG来作为底层实现方案,这样便于操控。
因此页面上的元素,也是利用的SVG的各种元素来实现的。
圆(circle) 通过SVG的circle元素来作图,比较简单。
1
2
3
4
5
6
7
8
9
10
11
12
function drawNodes (nodeGroups )append ('circle' )attr ('r' , n =>return n.type === 'person' ? options.node .person .radius : options.node .company .radius ;attr ('fill' , n =>return n.type === 'person' ? options.node .person .backgroundColor : options.node .company backgroundColor ;
**注意: **因为后面拖拽的时候,圆形和里面的文字是需要同步移动的,因此这里需要将每个node和文字,用一个g包裹起来:
1
2
3
4
5
6
7
8
9
10
11
12
13
14
15
16
17
function drawNodesAndTexts (nodes ) {let nodeGroups = getContainer ().selectAll ('g' )data (nodes)enter ()append ('g' )attr ('id' , n =>`node_${n.id} ` )classed ('node' , true )attr ('transform' , (d ) => {return `translate(${d.x} , ${d.y} )` ;call (drag ());drawNodes (nodeGroups)drawTexts (nodeGroups)
文本(text、tspan) 如果只是一行文本,通过text来实现即可;但是我们这个需求,因为文字内容不固定,可能有超过一行的情况,因此需要通过tspan来实现换行功能。
1
2
3
4
5
6
7
8
9
10
11
12
13
14
15
16
17
18
19
20
function drawTexts (nodeGroups )append ('text' )attr ('id' , n =>'text' + n.id )attr ('font-size' , n =>return n.type === 'person' ? personFontSize + 'px' : companyFontSize + 'px' ;attr ('fill' , n =>return n.type === 'person' ? 'white' : 'yellow' ;selectAll ('tspan' )data (n =>return wrapTextForAbsolute (n)enter ()append ('tspan' )attr ('x' , s =>x )attr ('y' , s =>y )text (s =>content )
上面的wrapTextForAbsolute(n)就是对文本进行换行处理,并计算换行后每个tspan的横纵坐标的函数:
1
2
3
4
5
6
7
8
9
10
11
12
13
14
15
16
17
18
19
20
21
22
23
24
25
26
27
28
29
30
31
32
33
34
function wrapTextForAbsolute (node ) {let fontSize = node.type === 'person' ? personFontSize : companyFontSize;let textLength = fontSize * node.name .length ;let diameter = node.type === 'person' ? options.node .person .radius : options.node .company .radius ;if (diameter * 2 >= textLength) {return [{content : node.name ,x : -node.name .length * fontSize / 2 ,y : fontSize / 2 let lineWidth = diameter * 2 - fontSize;let wordNumber = Math .floor (lineWidth / fontSize)let words = [];let level = 0 ;for (let i = 0 ; i < node.name .length ; i += wordNumber) {let word = node.name .substr (i, wordNumber);push ({content : word,x : -word.length * fontSize / 2 ,y : level * fontSizereturn words;
另外,如果想要做得精细一些,计算本文的长度时,应该将中文和非中文区别对待:中文占据2个宽度单位,非中文占据一个宽度单位:
1 2 3 4 5 6 7 8 9 10 11 12 13 14 15 16 17 18 export function computeLengthOfContent (str )let length = 0 ;for (let i = 0 ; i < str.length ; i ++) {let ascii = str[i].charCodeAt ();if (ascii > 127 ) {2 ;else {return length;
线条(line) 线条通过SVG的line元素来画的,这个很简单,只需要找到和线条关联的两个节点的坐标即可。
代码如下:
1
2
3
4
5
6
7
8
9
10
11
12
13
14
15
16
17
18
19
20
21
22
23
24
25
26
function drawRelationships (relationships ) {let container = getContainer ();selectAll ('line' )data (relationships)enter ()append ('line' )attr ('x1' , r =>return nodeMap[r.from ].x ;attr ('y1' , r =>return nodeMap[r.from ].y ;attr ('x2' , r =>return nodeMap[r.to ].x ;attr ('y2' , r =>return nodeMap[r.to ].y ;attr ('from' , r =>from )attr ('to' , r =>to )attr ('stroke' , 'black' )attr ('stroke-width' , '2px' )
两个节点之间有多条线怎么画? // TODO
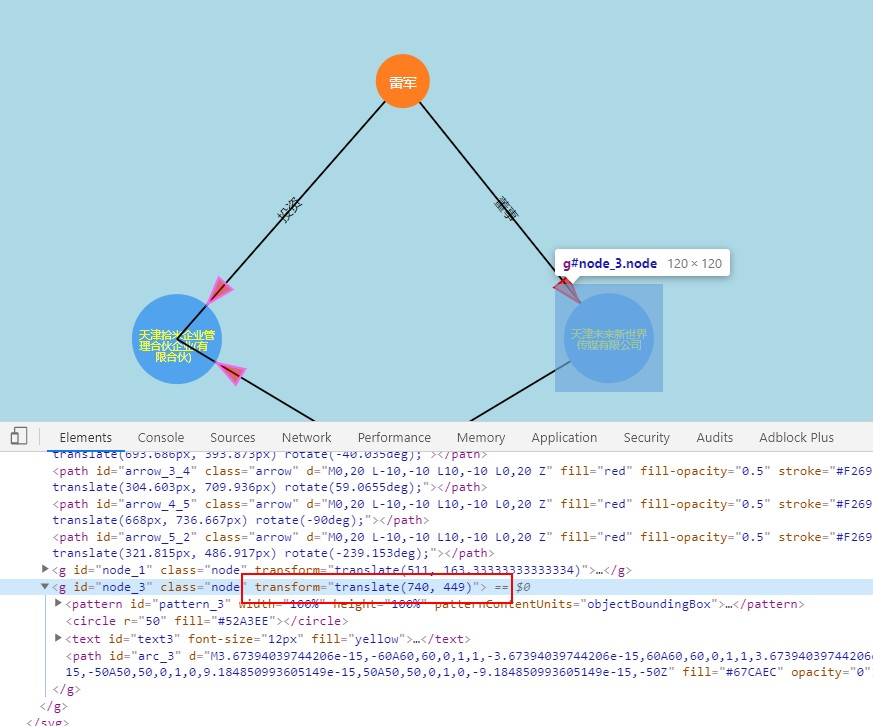
箭头(path) 这是一个相对较难的部分。
箭头其实是由一个几何三角形构成的,一开始我是准备算出每个箭头的三角形的三个顶点的坐标,然后去作图。后来经过尝试,发现这样做非常麻烦,因此准备换一种实现思路。
由于每个箭头都是固定大小的,因此我们可以预先在(0, 0)这个坐标点画好箭头,然后通过平移+旋转的方式,将其移动到正确的位置进行展示。
画箭头的代码大致如下:
1
2
3
4
5
6
7
8
9
10
11
12
13
14
15
16
17
18
19
20
21
function drawArrows (relationships ) {let container = getContainer ();selectAll ('path' )data (relationships)enter ()append ('path' )attr ('id' , r =>`arrow_${r.from } _${r.to} ` )attr ('d' , r =>return `M0,20 L-10,-10 L10,-10 L0,20 Z` ;attr ("fill" , "green" )attr ("fill-opacity" , 0.5 )attr ("stroke" , "red" )attr ("stroke-width" , 2.5 )style ("transform" , r =>let transform = getCoordinatesForArrows (r);return `translate(${transform.translateX} px, ${transform.translateY} px) rotate(${transform.rotate} deg)` ;
上述代码的关键,是getCoordinatesForArrows(r)这个函数,该函数计算出了箭头移动和旋转所需的数据,其原理是通过将箭头依附的线条平移到原点,然后通过三角函数算出箭头方向和坐标轴的夹角,进而算出所需的数据。
比如箭头依附的线条的真实位置是这样的:
我会先对其进行平移,将线条终点,即图中的点A移动到原点(0, 0),类似这样:
平移后,计算A和X轴的夹角,就非常方便了,直接用B平移后的x、y值就可以算出来。
算出来这个夹角后,我将其应用到箭头三角形,对其旋转,则可以保证箭头的方向和线条是一致的;然后我再给箭头,根据点A的原始坐标值,做一个平移,就可以让箭头位于点A附近了。
具体的代码如下(我为了在后面的拖拽交互中复用代码,因此对代码做了一个抽离,抽出了computePositionForArrow这个复用函数):
1
2
3
4
5
6
7
8
9
10
11
12
13
14
15
16
17
18
19
20
21
22
23
24
25
26
27
28
29
30
31
32
33
34
35
36
37
38
39
40
41
42
43
44
45
46
47
48
49
50
51
52
53
54
55
56
57
58
59
function getCoordinatesForArrows (link ) {let radiusOfNode = nodeMap[link.to ].type === 'person' ? options.node .person .radius : options.node .company .radius ;let fromX = nodeMap[link.from ].x ;let fromY = nodeMap[link.from ].y ;let toX = nodeMap[link.to ].x ;let toY = nodeMap[link.to ].y ;return computePositionForArrow (radiusOfNode, fromX, fromY, toX, toY)function computePositionForArrow (radiusOfNode, fromX, fromY, toX, toY )let centerLengthOfTriangle = 22 ;let centerBetweenTriangletoNode = centerLengthOfTriangle + radiusOfNode;let lengthOnTheline = 100 ;let offset = {x : toX,y : toYlet totalLineLength = Math .sqrt (Math .pow (fromX - toX, 2 ) + Math .pow (fromY - toY, 2 ));let xB = onlineX = (fromX - toX) * lengthOnTheline / totalLineLength + toX;let yB = onlineY = (fromY - toY) * lengthOnTheline / totalLineLength + toY;x ;y ;let tanB = yB / xB;let rotate = Math .atan (tanB) / (Math .PI / 180 );let translateX = (fromX - toX) * centerBetweenTriangletoNode / totalLineLength + toX;let translateY = (fromY - toY) * centerBetweenTriangletoNode / totalLineLength + toY;0 ? rotate - 90 : rotate + 90 ;if (toY < fromY) {180 ;return {
线条上的文字(text) 一开始我又陷入误区了,准备去计算这个文字标签的详细的偏移量,然后感觉我这个方案似乎不对,和之前刚开始画三角形箭头的时候一样,我又走入歧途了。
其实这个文字标签,完全可以利用三角形的思维,先把方框画好,然后再将这个方框偏移到原点,然后计算线条中点到原点的偏移量,对方框进行偏移,就可以实现所需的效果了。中心点思维。
画text标签的代码如下:
1 2 3 4 5 6 7 8 9 10 11 12 13 14 15 16 17 18 19 20 21 22 23 24 25 26 27 28 29 30 31 32 33 34 35 36 37 38 39 40 41 42 43 44 45 46 47 48 49 function drawRelationTags (relationships ) {let container = getContainer ();append ('g' ).selectAll ('text' )data (relationships)enter ()append ('text' )attr ('id' , r =>`tag_${r.from } _${r.to} ` )attr ('font-size' , n =>return options.relationship .text .fontSize ;attr ('fill' , n =>return options.relationship .text .color ;attr ('x' , r =>let position = initializeTag (r);return position.x ;attr ('y' , r =>let position = initializeTag (r);return position.y ;attr ('transform' , r =>let transform = computeCoordinateForRelationTag (r)return `translate(${transform.x} , ${transform.y} ) rotate(${transform.rotate} )` ;style ('background-color' , '#ADD8E6' )text (n =>let text;switch (n.type ) {case 'invest' :'投资' ;break ;case 'executive' :"董事" ;break ;default :"其他" ;break ;console .log (text);return text;
可以看到上面的代码,有两个关键的函数,分别是:
计算文本方框初始位置(即把方框的中心偏移到原点)的initializeTag():
1 2 3 4 5 6 7 8 9 10 11 12 13 14 15 16 17 18 19 20 21 22 23 24 25 26 function initializeTag (link )let text;switch (link.type ) {case 'invest' :'投资' ;break ;case 'executive' :"董事" ;break ;default :"其他" ;break ;let fontSize = options.relationship .text .fontSize ;let widthOfText = fontSize * text.length ;return {x : -1 * widthOfText / 2 ,y : fontSize / 2 - 3
以及计算文本框偏移量(即计算线条中点到原点的偏移量,对方框进行偏移)的computeCoordinateForRelationTag():
1
2
3
4
5
6
7
8
9
10
11
12
13
14
15
16
17
18
19
20
21
22
23
24
25
26
27
function computeCoordinateForRelationTag (link ) {let from = getNodePositionById (link.from );let to = getNodePositionById (link.to );let middle = {x : (from .x + to.x ) / 2 ,y : (from .y + to.y ) / 2 let relativeLinePosition = {x : from .x - to.x ,y : from .y - to.y let tan = relativeLinePosition.y / relativeLinePosition.x let angle = Math .atan (tan) / (Math .PI / 180 )return {x : middle.x ,y : middle.y ,rotate : angle
节点嵌入图片 网上找了一个例子:
1
2
3
4
5
6
7
8
9
10
11
12
13
14
15
16
17
18
<?xml version="1.0" encoding="utf-8" ?><svg version ="1.1" xmlns ="http://www.w3.org/2000/svg" xmlns:xlink ="http://www.w3.org/1999/xlink" xml:space ="preserve" > <defs > <pattern id ="avatar" width ="100%" height ="100%" patternContentUnits ="objectBoundingBox" > <image width ="1" height ="1" xlink:href ="http://userimg.yingyonghui.com/head/24/1458708838143/5426424.png-thumb" /> </pattern > <style > circle, rect { stroke: #ff9900 ; stroke-width : 5px ; } </style > </defs > <g > <circle cx ="100" cy ="100" r ="50" fill ="url(#avatar)" /> <rect x ="200" y ="50" rx ="20" ry ="20" width ="100" height ="100" fill ="url(#avatar)" /> </g > </svg >
这里有个实战案例,还涉及了图片的自适应高宽问题:
https://blog.csdn.net/weixin_30571465/article/details/95628764
然后项目中具体实现的代码如下(给circle设置fill属性的代码就省略掉了):
1
2
3
4
5
6
7
8
9
10
11
12
13
14
15
16
17
18
19
20
21
22
23
24
25
26
27
28
function drawImages (nodeGroups ) {append ('pattern' )attr ('id' , n =>return `pattern_${n.id} ` ;attr ('width' , n =>return '100%' ;attr ('height' , n =>return '100%' ;attr ('patternContentUnits' , 'objectBoundingBox' )append ('svg:image' )attr ('preserveAspectRatio' , 'none' )attr ('xlink:href' , n =>return 'http://i.thsi.cn/images/zcx/development/CPI.jpg' ;attr ('width' , n =>return 1 ;attr ('height' , n =>return 1 ;
交互 页面的缩放与平移(zoom) 缩放和平移用D3的zoom实现,也是比较简单的。
注意要把页面所有元素放入一个g中,即下面的container中。
1
2
3
4
5
6
7
8
9
10
11
12
13
14
15
function initZoom (let svg = getSVG ();let container = getContainer ();let zoomHandler = new d3.zoom ()scaleExtent ([0.1 , 10 ])translateExtent ([[-100 , -100 ], [options.grid .width + 90 , options.grid .width + 100 ]])on ('zoom' , () => { attr ('transform' , d3.event .transform ) call (zoomHandler)
平移动画 通过CSS的transform和transition来实现。
不过要注意的是,D3对transition做了封装,不能直接用类似attr(‘transition’, ‘all 2s’)的这种写法,而是应该这样:
1 2 3 4 5 6 7 8 9 10 11 12 13 14 15 function moveView (x, y )let transition = d3.transition ()duration (1500 )ease (d3.easeLinear );getContainer ()transition (transition)attr ('transform' , `translate(${x} , ${y} )` )
详见transition的API
拖拽(drag) 这个交互是耗时最久的部分。
虽然D3提供了drag拖拽交互,但是那是针对单个元素的,而我们的拖拽,要保证节点、节点内部的文字、和节点关联的线条、和节点关联的箭头,都同步移动。这样要控制的数据就比较多了。
参考上面画圆(circle)部分的代码,我们是将圆和里面的文本放入了一个g标签中,然后对这个g标签绑定了拖拽事件:
1
2
3
4
5
6
7
8
9
10
11
12
13
14
15
16
17
function drawNodesAndTexts (nodes ) {let nodeGroups = getContainer ().selectAll ('g' )data (nodes)enter ()append ('g' )attr ('id' , n =>`node_${n.id} ` )classed ('node' , true )attr ('transform' , (d ) => {return `translate(${d.x} , ${d.y} )` ;call (drag ());drawNodes (nodeGroups)drawTexts (nodeGroups)
我们会在这个drag()函数里面,去动态修改相关元素的坐标信息:
1
2
3
4
5
6
7
8
9
10
11
12
13
14
15
16
17
18
19
20
21
22
23
24
25
26
27
28
29
30
31
32
33
34
35
36
37
38
39
40
41
42
43
44
45
46
47
48
49
50
51
52
53
54
55
56
57
58
59
60
61
62
63
64
65
66
67
68
69
70
71
72
73
74
75
76
77
78
79
80
81
function drag (return d3.drag ()on ('drag' , move)function move (d )let x = d3.event .x ,event .y ;if (!inBoundaries (x, y)) {return false ;select ('#coordinate' ).html (`x=${x} , y=${y} ` )let element = d3.select (this );raise ()attr ('transform' , () => {return `translate(${d.x = x} , ${d.y = y} )` ;let id = element.attr ('id' );if ('undefined' === typeof id) {return ;let idInfo = id.split ('_' )if ('undefined' === typeof idInfo[1 ]) {return ;1 ];selectAll (`line[from="${id} "]` )attr ('x1' , x)attr ('y1' , y)selectAll (`line[to="${id} "]` )attr ('x2' , x)attr ('y2' , y)let radiusOfNode;parseInt (id)relationships .forEach (r =>let arrowId = `arrow_${r.from } _${r.to} ` ;let transform;let needTransform = false ;if (r.from === id) {true ;let toNode = nodeMap[r.to ];to ].type === 'person' ? options.node .person .radius : options.node .company .radius ;computePositionForArrow (radiusOfNode, x, y, toNode.x , toNode.y )else if (r.to === id) {true ;let fromNode = nodeMap[r.from ];to ].type === 'person' ? options.node .person .radius : options.node .company .radius ;computePositionForArrow (radiusOfNode, fromNode.x , fromNode.y , x, y)if (needTransform) {select (`#${arrowId} ` )style ("transform" , (oldR ) => {return `translate(${transform.translateX} px, ${transform.translateY} px) rotate(${transform.rotate} deg)` ;function inBoundaries (x, y )let r = 10 ;return (x >= (0 + r) && x <= (options.grid .width -r))0 + r) && y <= (options.grid .height -r))
边框透明 直接在g里面添加一个圆弧(arc)即可,且因为节点的偏移是作用在g上面的,这个圆弧画好后,不用单独设置偏移,会自动根据g的位置进行定位,很方便。
边框旋转 灰化 灰化的实现也比较简单,只需要根据逻辑获取对应的数据,然后找到对应的页面元素,修改其样式属性即可。
动画播放 点击 这里会遇到一个问题:当存在元素叠加的时候(比如节点和里面的文字),点击事件如何绑定?
绑定到二者的父元素上面,即g上面。
另外,点击的时候,关联节点和非关联节点的样式都要重新设置过,因为你可能点击多次,之前已经灰化的节点,在下次点击后,可能是需要解除灰化的。
数据驱动的理念现在还是没有一个很好的实现方案。
比如点击节点的时候,和被点击节点相关联的节点和线条不变,其他节点和线条都灰化,这个本来应该通过数据驱动的形式去实现,但是现在其实是手动获取数据,再手动去找到对应元素,然后修改每个元素的样式,这感觉并不是一个好方案。
如何将数据和页面元素解绑? 我之前给页面元素写了很多属性,后面操作数据的时候(比如找到和某个Node相关的线条的数据),无法解绑了。
视觉效果 渐变 渐变是通过defs和linearGradient元素来预定义,然后在具体的图形元素(比如circle)中引用这个预定义的渐变来实现的。
定义 1 2 3 4 5 6 7 8 9 10 11 12 13 14 15 16 17 18 19 20 21 22 23 24 25 26 27 28 29 30 31 32 33 34 35 36 37 38 39 40 41 42 43 44 45 46 47 48 49 50 51 52 53 54 55 56 57 58 59 60 61 62 63 64 65 66 67 68 69 70 71 72 73 74 75 76 77 export function defineGradients (nodes ) {let maxRate = 0.1 ,0.1 ;forEach (n =>rate > maxRate ? maxRate = n.rate : null ;rate < minRate ? minRate = n.rate : null ;let container = getContainer ();selectAll ('defs' )data (nodes)enter ()append ('linearGradient' )attr ('id' , n =>`linearGradient_${n.id} ` )attr ('x1' , '0%' )attr ('y1' , '0%' )attr ('x2' , '100%' )attr ('y2' , '100%' )selectAll ('stop' )data (n =>return generateGradientColor (n.rate , minRate, maxRate);enter ()append ('stop' )attr ('offset' , (d, i ) => {return i === 0 ? '0%' : '100%' ;attr ('stop-color' , d =>export function generateGradientColor (rate, minRate, maxRate ) {if (null === rate) {return [options .node .normal .backgroundColor .default ,options .node .normal .backgroundColor .default let gradient = data.options .node .normal .backgroundColor .gradient ;let minRGB = gradient[0 ].split (',' );let maxRGB = gradient[1 ].split (',' );if (minRGB.length < 3 || maxRGB.length < 3 ) {alert ('gradient 配置有误!' )return false ;let b = d3.rgb (minRGB[0 ], minRGB[1 ], minRGB[2 ]) let a = d3.rgb (maxRGB[0 ], maxRGB[1 ], maxRGB[2 ]) let compute = d3.interpolate (b, a);let linear = d3.scaleLinear ()domain ([minRate, maxRate])range ([0 , 1 ])let fix = rate > 0 ? 0.1 : -0.1 ;let color = [compute (linear (rate + fix)),compute (linear (rate))return color;
引用 1 2 3 4 d3.select ('rect' )style ('fill' , d =>return `url(#linearGradient_${d.name} )` ;
布局 力导向 优化 重叠问题 线条上的文本重叠 比如两个线条相交,导致位于中间的文本叠加了。
这个应该可以通过层级来解决,每个元素都有一个不同的层级。
层级问题 比如线条画在了圆圈上面,没有被圆圈遮住。
// TODO
一些技巧 debugger F11一路跟下去,不要纠结,除非你非常确定问题的原因,否则这就是最高效的调试方法。
辅助线 比如角度的辅助线
比如坐标的辅助线
debug输出函数 开发过程中的输出不要直接删掉,通过调试函数来输出,否则后面出现问题,又要重新添加调试输出,很麻烦。
可以在最终的打包工具中,写个插件,自动把调试代码删除即可。
给样式和id增加一个前缀 这样做的目的是避免和业务方自己定义的样式名/id冲突。
想法 如何理解数据驱动? 这里的关键,是要能够实现数据变更后,页面的绘图层自动随之变更。
这是通过数据监听,即观察者模式来实现的。
那么存储数据的载体是什么?如何对载体进行监听?针对数据驱动的模式,在编写视图层代码时,有哪些要注意的地方呢?
存储数据的载体是什么? 因为页面的元素可能比较多,我们自己创建一个数据结构去存储这些数据是不大现实的。
考虑到视图的变更,都是由CSS样式来决定的,因此我们完全可以利用元素的CSS属性作为数据载体。
SVG元素的样式,大多都会绑定到元素属性(attr)上,因此我们经常通过element.attr(attributeName)去获取数据,比如获取transform的值:
1 d3.select ('#test' ).attr ('transform' )
如何对载体进行监听? 可以参考Vue的实现思路:
https://www.jianshu.com/p/23180880d3aa
实现mvvm的双向绑定,是采用数据劫持结合发布者-订阅者模式的方式,通过Object.defineProperty()来劫持各个属性的setter,getter,在数据变动时发布消息给订阅者,触发相应的监听回调。
由于页面上可能存在多个同类型的元素,因此必须提前确定好规则,给每个元素绑定一个唯一的属性,便于后面根据该属性定位到该元素。
且这个唯一属性必须是和数据本身有关联的,比如数据中的id这种。
编写视图层代码的注意事项 一定要和具体数据解绑,将数据以参数的形式传入进去。
这是为了方便对具体数据监听后,可以传入变更的数据,进而触发页面的重新绘制。
问题 为什么我在第二次拖动节点时,节点会回到初始位置? 这种情况,是在我处理拖拽的时候,给节点所在的g设置transform属性时,没有同时设置节点数据的d.x和d.y时,出现的现象。
这是会出现这个问题的代码:
1 2 3 4 5 let element = d3.select (this );raise ()attr ('transform' , () => {return `translate(${x} , ${y} )` ;
这是没有问题的代码:
1
2
3
4
5
let element = d3.select (this );raise ()attr ('transform' , () => {return `translate(${d.x = x} , ${d.y = y} )` ;
原因就是如果我不设置dx = x和dy = y,那么在拖拽动作触发时,此时节点所在的g,其transform属性的值还是页面初始渲染时的值,因此节点就会跳转到初始位置了。